Ask a validation lead what their release regression covers and you will usually get a spreadsheet. Requirements down the side, test scripts across the top, a tick where one references the other. It is a reasonable document. It is also a statement of intent, not a record of what happened when the suite last ran against the sandbox.
This post is about a different definition of coverage: one computed from the artifacts a run leaves behind. Which routes were exercised. Which checks produced a verdict on each of them. Which market configuration the flow was replayed against. The definition is narrower than the spreadsheet in one way and much stronger in another, and being precise about that trade-off is what makes it useful in a regulated release.
Three coverage definitions and what each one measures
Before defining a fourth, it is worth being honest about the three you already have.
| Definition | What it measures | What it cannot tell you | Who maintains it |
|---|---|---|---|
| Requirement traceability matrix | Intent: every requirement has a test script that references it | Whether the script ran on this build, against this configuration, and what it checked | Humans, by hand, drifting after every change |
| Code coverage | Which lines or branches executed | Anything about a vendor SaaS you cannot instrument. Vault, Salesforce, SAP: not available | The vendor's engineers, for the vendor's purposes |
| Test-case count | Effort: how many scripts exist | Surface. Two hundred scripts on one screen and zero on another is still two hundred | Whoever owns the test repository |
| Data-based coverage | Execution: which routes were exercised, under which checks, for which market, on which build | Intended use. It proves exercise, not fitness for purpose | The run itself, from artifacts |
None of the first three is wrong. The traceability matrix is what your QA policy asks for and it stays. The problem is that teams use it to answer a question it was never built for: did the last release regression actually touch everything we said it would? A matrix cannot answer that, because it does not know the run happened.
Where the data comes from

In Lastest, a recorded flow becomes plain Playwright code in your git repo. When it replays, there is no model inference in the loop; the same code runs the same way on every build, inside your network via docker compose, air-gapped if you need it. That determinism is what makes the artifacts trustworthy as evidence: a screenshot labelled call-report-submitted was taken at that step, on that build, because the code said so.
Each run leaves behind:
- Labelled screenshots, several per test, so a multi-page flow is recorded as a sequence of named screens rather than a single end state.
- The routes visited, extracted from the URL layer, which is what turns a flow into rows in the matrix.
- A verdict per check layer on each screen. There are nine core layers: visual, text, DOM, network, console, performance, URL, API and storage, plus accessibility and design-system plugin layers. Each layer is set per repo to enforce, log, or disable.
The coverage matrix per repo is route by layer. A cell is filled if at least one run exercised that route and the layer produced a verdict there. It carries the mode too, so an auditor can distinguish "visual enforced on the call-report screen" from "visual only logged on the call-report screen". The two are not the same evidence, and a checklist tick cannot tell them apart.
The third axis: market
For a single-country deployment two axes are enough. For a pharma rollout of Veeva Vault CRM across a dozen markets, they are not, because the configuration under test is different per country. Different page layouts, different mandatory fields, different consent flows, different sample-management rules.
Veeva ships three general releases a year. The Release Impact Assessment you receive is generic; it describes what changed in the platform, not what changed in your German configuration. Performance qualification on your own configuration is yours to produce. So the question a validation lead needs answered before each general release date is specific: for every market we operate in, which flows did we exercise, and under which checks?
Lastest answers it by replaying the same recorded flow once per country, driven by rows in the scenario spreadsheet you already keep. The market becomes the third axis of the matrix, and gaps get a precise shape:
- "Flow
sample-ordernever executed for market JP." - "Layer
networkonly in log mode for market FR on/call-report." - "Route
/consent-captureexercised in DE and IT, absent everywhere else."
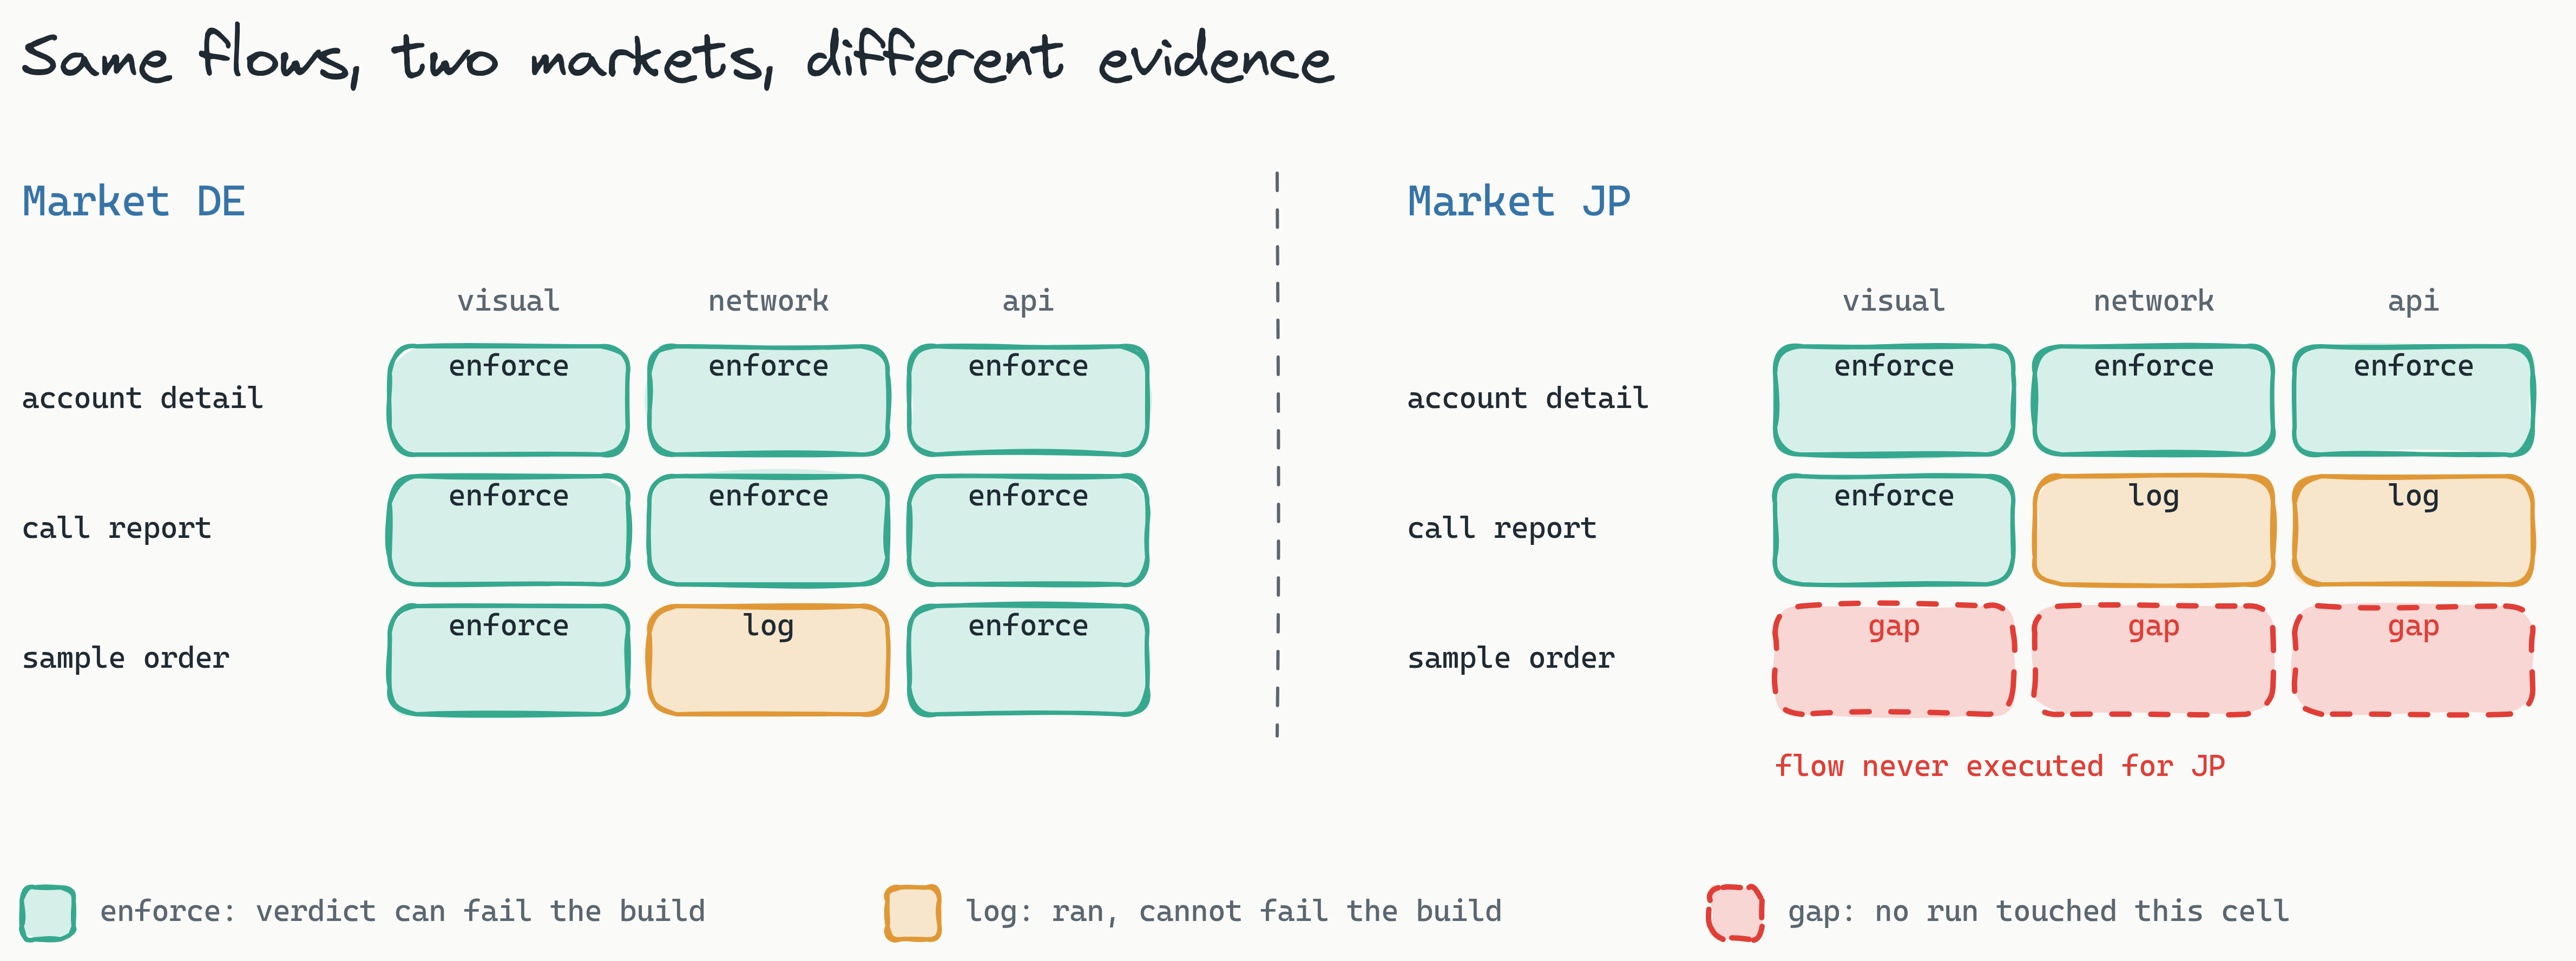
Here is the same slice as a table, the way it appears in a release-readiness review.
| Route | Layer | DE | FR | JP |
|---|---|---|---|---|
| /account-detail | visual | enforce | enforce | enforce |
| /account-detail | network | enforce | enforce | enforce |
| /call-report | visual | enforce | enforce | enforce |
| /call-report | network | enforce | log | log |
| /call-report | api | enforce | enforce | log |
| /sample-order | visual | enforce | enforce | gap |
| /sample-order | network | log | enforce | gap |
| /sample-order | api | enforce | enforce | gap |
Every gap and every log-only cell on that table is a decision to make before the general release date, not a surprise to explain after it. Some will be deliberate: sample orders may genuinely not exist in the Japanese configuration. The point is that the decision is now visible and dated, which is what an inspector asks for.
What the data looks like
Coverage is stored per build, so the trend is available and so the numbers can be read by something other than a person. This is the shape an auditor or an agent gets back, trimmed to one route:
{
  "repo": "vault-crm-release-regression",
  "build": "26R2-sandbox-2026-09-02",
  "health": { "score": 84, "pass_rate": 0.96, "non_flaky_rate": 0.91, "route_coverage": 0.72 },
  "markets": ["DE", "FR", "JP"],
  "routes": {
    "/sample-order": {
      "screens": ["sample-order-form", "sample-order-review", "sample-order-confirmed"],
      "layers": {
        "visual":  { "DE": "enforce", "FR": "enforce", "JP": null },
        "network": { "DE": "log",     "FR": "enforce", "JP": null },
        "api":     { "DE": "enforce", "FR": "enforce", "JP": null },
        "a11y":    { "DE": "log",     "FR": "log",     "JP": null }
      },
      "last_verdict": { "DE": "pass", "FR": "pass", "JP": null }
    }
  }
}
A null is a gap. A "log" is a check that ran but could not fail the build. Neither hides behind a green tick.
The health score, and what it is not
The 0 to 100 health score combines three things: pass rate at 60 percent weight, non-flaky rate at 20 percent, and route coverage at 20 percent. The weighting is deliberate. A suite that passes everything but exercises a third of the routes should not look healthy, and a suite that covers every route but flakes on half of them should not either.
Treat the score as a trend indicator for the team, not as an acceptance criterion. Acceptance is defined by your URS and your PQ scripts. The score tells you whether the regression suite underneath them is getting more or less trustworthy from build to build.
Coverage before recording: the selector scan
There is one more coverage measurement, and it happens before any test exists. When you point the recorder at a Vault sandbox, a pre-recording scan measures how much of the surface is addressable by stable selectors: data-testid, aria attributes, and id. It then recommends a selector priority for the repo.
This matters for a vendor SaaS in a way it does not for your own application. You cannot add test IDs to Vault. What you can do is know, up front, that the call-report screen is 80 percent addressable by ARIA labels and the sample-order grid is not, and choose your recording strategy accordingly. Low selector coverage on a screen is an early warning that the route will need more repair over the three yearly releases, and the scan tells you that before you have invested in it.
Closing the loop: coverage drives what gets authored next
The matrix is not only a report. It is the input to the QA agent's plan. When the agent proposes what to author next, it reads the matrix, so the proposal is "record the sample-order flow against the JP configuration and promote network to enforce on FR call reports" rather than a generic list of screens. AI is involved at authoring and repair time only; the tests it helps write are plain Playwright committed to your repo, and their replay involves no model at all.
The same data is exposed through the MCP server, so any agent your team runs, or an auditor's tooling, can query it directly: which markets lack coverage on which routes, what changed since the last build, which layers are still in log mode. Coverage stops being a slide prepared for a meeting and becomes a queryable fact about the system. You can see the shape of this on the pharma coverage overview and the full layer list on the features page.
What data-based coverage can and cannot claim
This is the section to read twice if you own the validation package.
It can claim: this route was exercised on this build, for this market, and these layers produced a verdict in this mode. The evidence is the artifact set: labelled screenshots, network and console logs, diff results from the pixel, SSIM and perceptual engines. All of it lives in your infrastructure and your git history, which is what makes it citable.
It cannot claim: that the system is fit for its intended use. Exercising the call-report screen under nine checks proves the screen still behaves the way it did on the last known-good build. It does not prove that the way it behaves is what the business requires. That claim belongs to the URS and the PQ scripts, executed and signed by qualified people. Data-based coverage tells you the regression net under those scripts has no holes in it for this release. It does not replace the scripts.
The honest positioning, then, is that the matrix answers the question the RTM cannot, and the RTM answers the one the matrix cannot. You need both, and the matrix is the one you have probably been doing by assertion rather than by measurement.
For the application-specific setup underneath all this, the auth bridge, seeded data and sandbox conventions are in the Vault CRM recipe, and the study-level considerations are in the Vault Clinical recipe. The overall approach for Veeva releases is on the Veeva Vault release testing page.
Frequently asked
Does a coverage matrix replace our requirement traceability matrix? No. The RTM records which requirement each script is meant to verify; the coverage matrix records which routes and layers each run actually exercised, per market and per build. They answer different questions. Keep the RTM for intent and use the matrix to prove execution.
How is route coverage computed when we cannot instrument Veeva Vault? From the run itself. The URL layer records every route the replay visited, labelled screenshots record every screen, and each check layer records a verdict where it ran. No code instrumentation of the vendor application is needed, which is the point: it works on any web application you can reach with a browser.
Where does the coverage data live and who can read it? In your deployment. Lastest runs inside your network via docker compose, air-gapped if required, and the tests are plain Playwright in your git repo. The matrix and per-build history are exposed through the MCP server, so your own agents and audit tooling can query them without any data leaving your environment.
Can the health score be used as a release acceptance criterion? Use it as a trend, not a gate. It weights pass rate at 60 percent, non-flaky rate at 20 percent and route coverage at 20 percent, which tells you whether the regression suite is becoming more or less trustworthy. Acceptance for a GxP release is defined by your URS and PQ scripts, not by a suite health number.
Before the next general release
Three general releases a year means three dates on which the question "what did we actually exercise, per market?" needs an answer you can show. Build the matrix from the runs, put the gaps in front of the application owner while there is still time to record the missing flow, and keep the RTM for what it is good at. Book a release-readiness review and we will map your routes, layers and markets into a first coverage matrix against your sandbox.